
Each year, Clean Edge, an American research and advisory firm devoted to the clean-tech sector, puts out its U.S. Clean Tech Leadership Index. The index ranks states and metro areas using more than 100 indicators of clean tech development. With the 2017 report due out in the next month, it’s worth examining where Sacramento has been ranked by Clean Edge in recent years.
In 2014 Sacramento came in with an impressive #5 composite ranking, mostly fueled by its #1 ranking in Clean Electricity & Carbon Management category thanks in large part to our municipally-owned utility SMUD, that is dedicated to the growth of low-carbon energy sources.
2015 saw a decline in Sacramento’s composite ranking, dropping 6 places to #12 nationally. Much of this slip can be attributed to dropping to #18 in Clean Electricity & Carbon Management category as the way the category ranking was determined underwent significant changes from previous years.
2016 Clean Tech Leadership Index
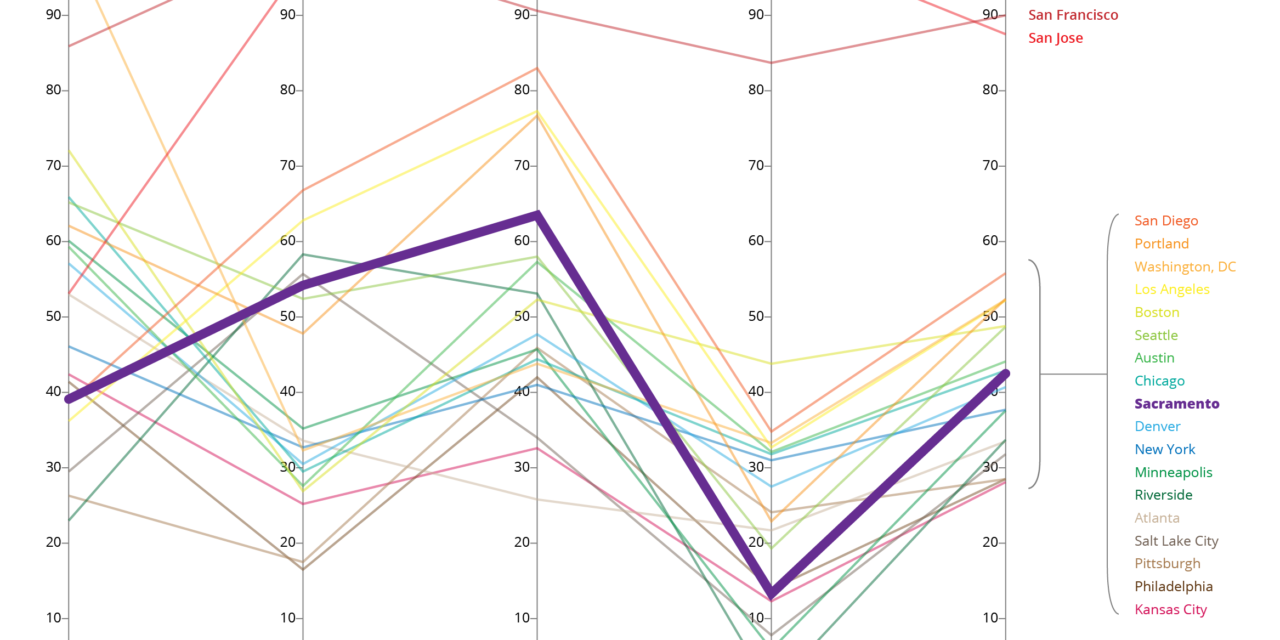
Overall, Sacramento’s national ranking improved slightly in 2016 over 2015, moving up to the number 11 spot behind a much stronger performance in the Clean Electricity & Carbon Management category. Clean Edge ranks the cities for four categories; Green Buildings, Advanced Transportation, Clean Electricity & Carbon Management, and Clean-Tech Investment, Innovation, and Workforce as well as a composite of the four. The graph below shows how Clean Edge ranked Sacramento in 2016 compared to other U.S. cities for the four categories as well as the composite.
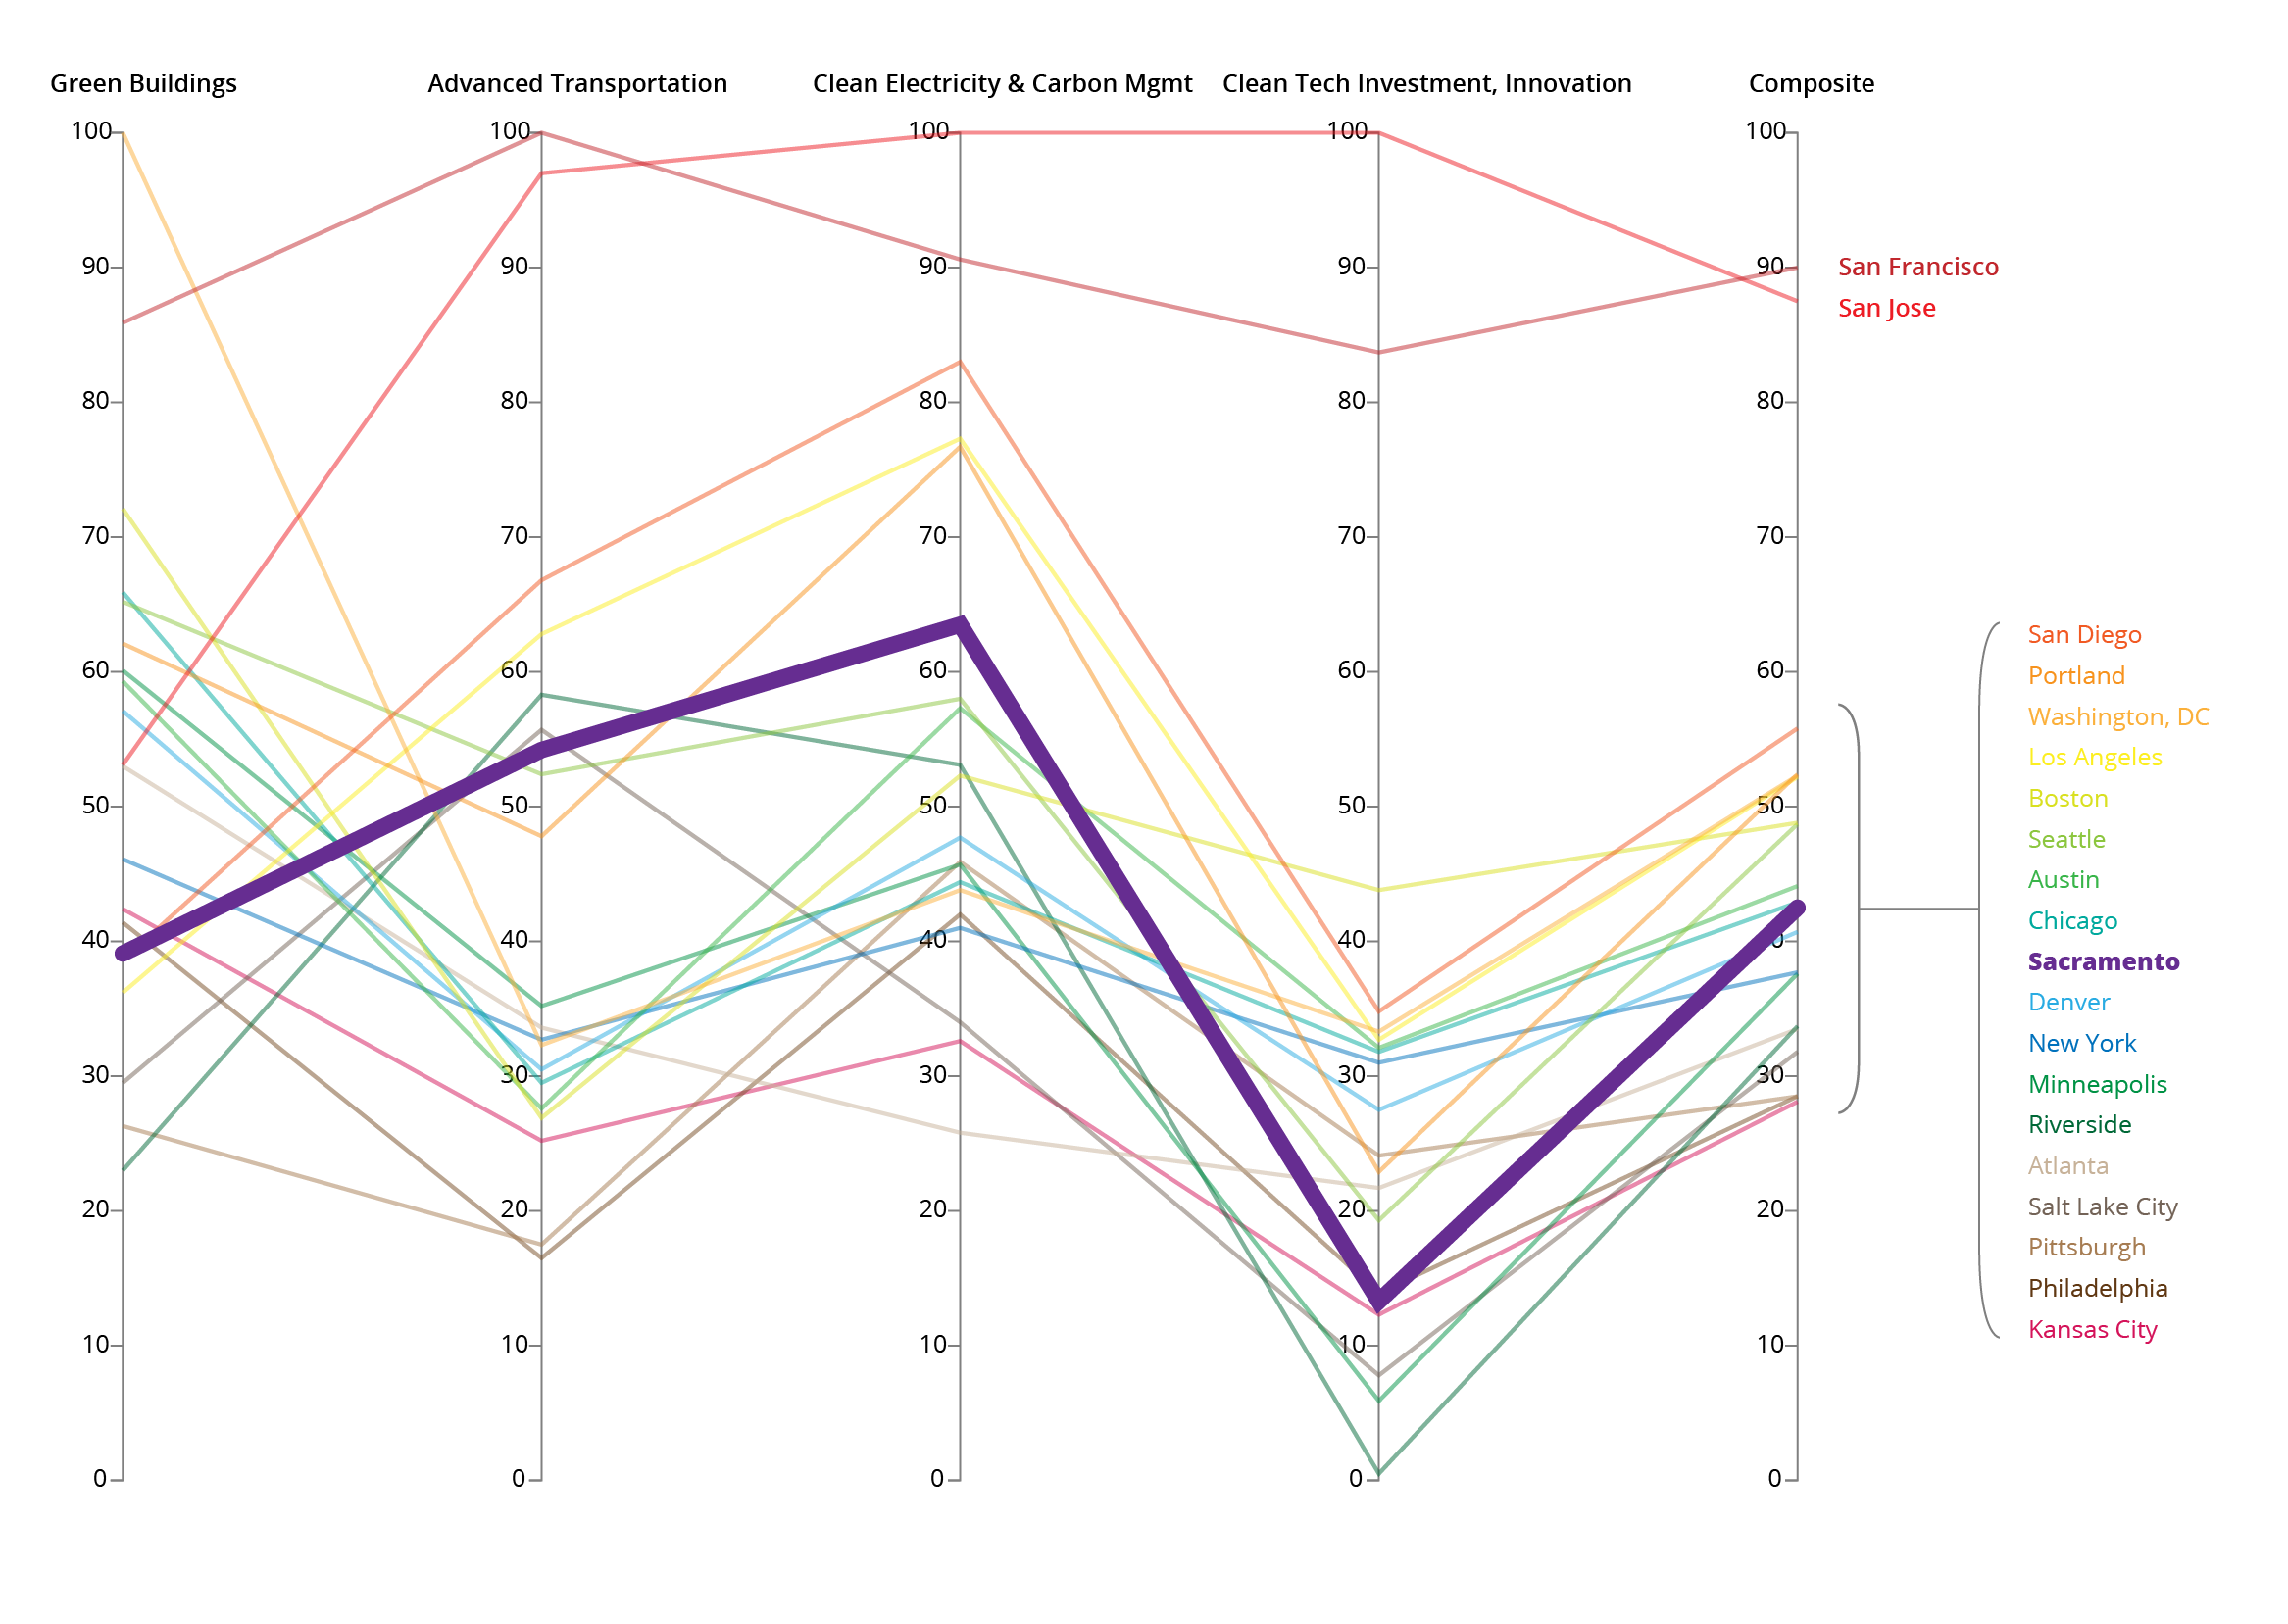
Clean Edge 2016 Clean Tech Leadership Index Scores
The chart below shows how Sacramento’s scores have changed over time for each of the four categories and the composite.
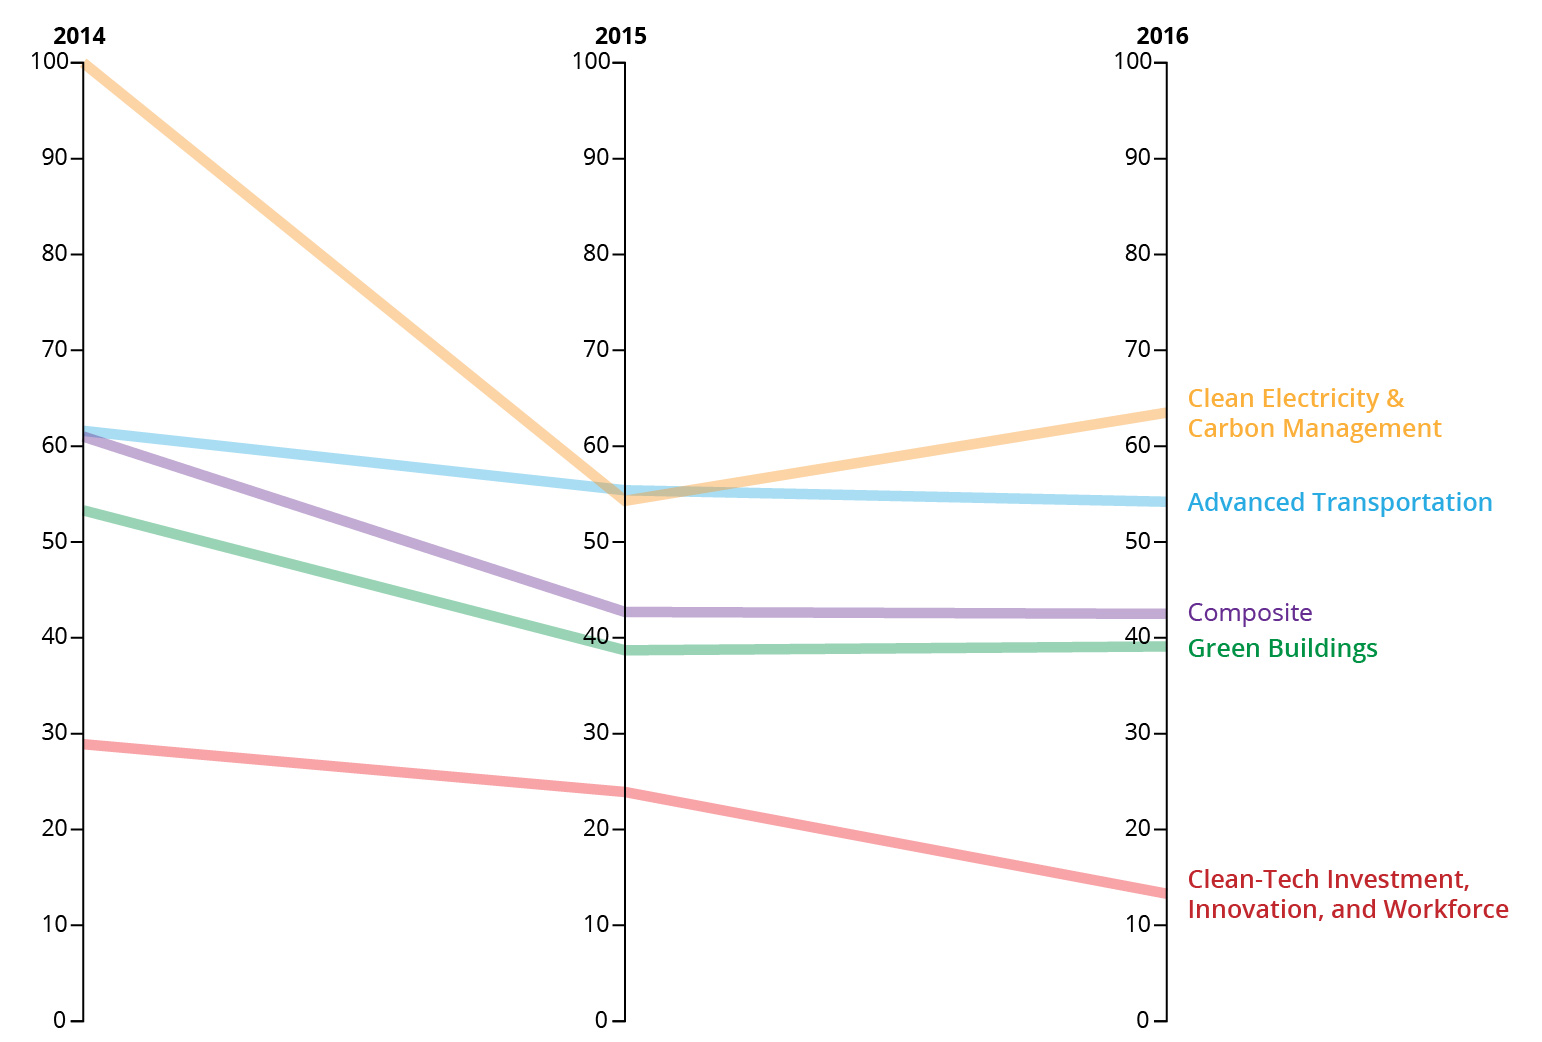
How Sacramento’s scores have changed for the four categories and composite over the last three years.
Green Buildings
The Green Buildings category is comprised of four indicators that measure green building deployment, two each for LEED- and Energy Star-certified buildings. In 2016 Clean Edge ranked Sacramento at #16 nationally with a score of 39.1, a decrease from its 2015 ranking at #13 and 2014 ranking at #7 nationally.
Advanced Transportation
Sacramento has consistently ranked well nationally in the Advanced Transportation category and came in at #7 again in 2016, the same as it did in 2014 and 2015. The Advanced Transportation category consists of eight indicators covering four types of advanced vehicles, their related charging or fueling infrastructure, and public transportation ridership. Sacramento ranked #8 in hybrid electric vehicles in use with 22.14 per 1,000 people, #8 in electric vehicles in use with 1.82 in use per 1,000 people, and #5 in electric vehicle charging stations with 109.5 per 1 million people.
Clean Electricity & Carbon Management
In 2016 Sacramento roared back up into the top ten in the Clean Electricity & Carbon Management category coming in at a respectable #6. “This category consists of a mixture of qualitative and quantitative measures. The quantitative indicators include two that use state-level electricity generation data as a proxy for local clean electricity; one that measures carbon emissions from large industrial and power-producing facilities; and a new indicator measuring installed solar power in each metro’s principal city. The qualitative measures have increased this year, with new indicators giving credit for reporting and reducing carbon emissions, and for setting high renewable electricity goals.”
Sacramento tied for 3rd place in regional electricity mix with 30.5% of total electricity generated from solar, wind, geothermal, hydroelectric, and biomass and comes in as the #5 city with the least carbon emissions from large facilities.
Clean-Tech Investment, Innovation, and Workforce
If there’s a perennial achilles heal for Sacramento’s rankings in the Clean Edge report it’s the Clean-Tech Investment, Innovation, and Workforce category. In the previous two years Sacramento ranked #14 nationally, but dipped to #23 in 2016. This category “measures a metro area’s financial, human, and intellectual capital. It tracks indicators such as venture capital investments in clean tech, clean-energy patent activity, and the presence of U.S. Department of Energy labs, clean-energy incubators, and top-rated green Master’s programs.”
Any time venture capital is compared in cities it’s going to be difficult to rank well against San Jose and San Francisco and this can be seen in the large gap between those two cities and the remainder of the pack in this category in the chart above. But the category also measures intellectual capital. With so much innovation coming out of UC Davis and the success of local clean tech startups like Sierra Energy, it seems likely that Sacramento should see some gains in this category in coming years. This optimism is supported by Sierra Energy CEO Mike Hart’s bullish outlook on the region’s green tech industry;
“The number of people I talk to in clean energy startups in this region is growing every day. It’s very impressive to me particularly on the “soft side” of clean energy, that seems to be predominant in this area. That is, you’ve got people that are looking for demand reduction models, software, programs, apps that allow people to shed or reduce demand. That is a huge area of opportunity. And a lot of things in the bio space – biological processes that create clean fuels and catalysts and such. That’s a huge area of growth in this region.” ~ Mike Hart, CEO Sierra Energy
The 2017 U.S. Clean Tech Leadership Index report is due out soon, probably in May, and if recent news is any indication, Sacramento may see some gains in the index. For example, the Sacramento Business Journal reported that SMUD reported an all-time high in solar energy installations, anchored by Golden 1 Center 700-kilowatt array. Could the surge in solar energy installations push up Sacramento’s scores in green buildings and clean electricity? Keep an eye out for the 2017 U.S. Clean Tech Leadership Index report to find out.


